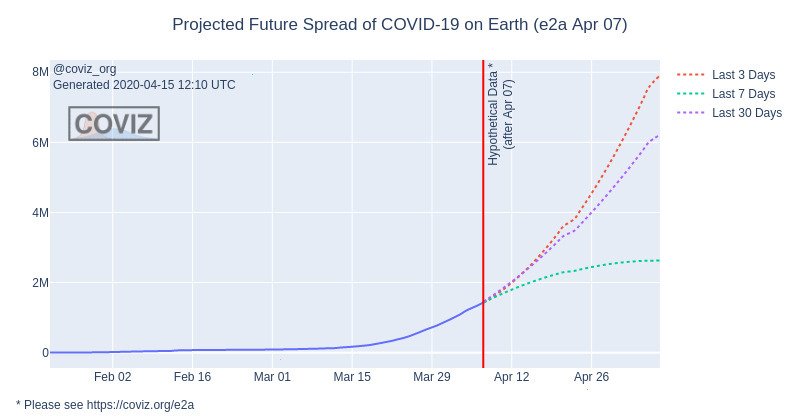
I woke up on April 2nd to discover that over 1 million people on earth had tested positive for coronavirus.
It took over 4 months for COVID-19 to hit 1 million world-wide, and the graph was showing a horrifying exponential growth of cases. When I saw this, a question popped-into my head: when will it hit 2 million? (spoiler: it took only 13 days to go from 1 million to 2 million)
When will it infect 4 million? 8 million? 100 million? 1 billion? 50% of the population on Earth?
I searched-and-searched, but I couldn’t find a website that was extrapolating the COVID-19 dataset daily to predict the future spread of the virus, so I decided to build one myself.
Introducing The Coviz Project
coviz.michaelaltfield.net is a new website that not only displays useful charts predicting the spread of coronavirus–it serves as a platform for others (with more credentials than me) to build and submit their own Extrapolation Models.
I launched the website with one simple extrapolation model that does a second-degree polynomial curve fit on the most-recent [a] 3-, [b] 7-, and [c] 30-days of the dataset. This is an oversimplified model that is prone to many errors, but it serves as a useful example for others to develop their own, more sophisticated, models.
If you’d like to build your own extrapolation models from the COVID-19 dataset, please see my guide to developing and submitting models.
Update 2023-12-27: This article was updated to reflect the deprecation of coviz[.]org to its archive subdomain coviz.michaelaltfield.net
Related Posts
Hi, I’m Michael Altfield. I write articles about opsec, privacy, and devops ➡


Leave a Reply